You answer calls all day, but you cannot prove what really happens on the line. No proof, no budget, no change.
Call analytics is how you turn raw calls, recordings, and metadata into structured KPIs and insights so you can measure performance, improve customer experience, and coach agents with facts.

With a modern VoIP or SIP PBX, you already have rich data: call detail records (CDRs) 2, queue events, recordings, even Mean Opinion Score (MOS) methodology 3. Call analytics gives this data a home. It connects call logs, speech analytics, and CRM records so you can track AHT, FCR, sentiment, and outcomes on one screen instead of ten different reports.
How do I track my KPIs like AHT and FCR?
You feel that calls take too long and customers call back too often, but “feeling” does not convince finance or the CEO.
You track AHT and FCR by combining call logs, queue events, and CRM or ticket data into a single dataset, then applying simple formulas and dashboards that update daily or in real time.

Turn raw logs into clear service KPIs
Start with clear definitions. For service and support teams, the core KPIs usually include:
- AHT (Average Handle Time): talk time + hold time + after-call work.
- ASA (Average Speed of Answer): time from queue entry to answer.
- FCR (First Call Resolution): percentage of issues resolved on the first contact.
- Abandon rate: percentage of callers who hang up before reaching an agent.
- Occupancy: how much of an agent’s time is spent on live calls and wrap-up.
You calculate these from a mix of sources:
- Call logs / CDRs from your SIP PBX or cloud system.
- Queue statistics (join, leave, answer events).
- CRM or ticket system for case status and repeat contacts.
Here is a simple view:
| KPI | Basic formula (concept) | Data you need |
|---|---|---|
| AHT | (Total talk + hold + wrap-up time) ÷ number of handled calls | Per-call handle time and wrap-up timestamps |
| ASA | Total wait time for answered calls ÷ number of answered calls | Queue join and answer time |
| FCR | Issues resolved on first contact ÷ total issues | Call IDs + ticket outcomes and reopen flags |
| Abandon rate | Abandoned calls ÷ total incoming calls | Queue entries and abandon events |
For AHT and ASA, your VoIP platform already knows start, answer, hold, and end times. For FCR, you need one extra step.
Make FCR real, not a guess
True FCR does not live only in the phone system. It lives where the issue lives, usually your CRM or helpdesk.
To measure it:
- Give each interaction a common key (ticket ID, case ID, or customer ID plus time window).
- Mark the ticket as resolved when the agent closes it.
- Track whether the same issue reopens or triggers another contact within a defined period (for example 3 or 7 days).
Then you know:
- Which calls led to true resolution.
- Which issues needed multiple contacts.
- Which agents or teams have stronger FCR performance.
You combine this with AHT to see patterns:
| Pattern | What it could mean |
|---|---|
| Low AHT, low FCR | Fast but shallow calls, customers call back |
| High AHT, high FCR | Longer calls but deeper resolution |
| High AHT, low FCR | Inefficient handling and weak resolution |
| Medium AHT, high FCR | Healthy balance |
In my own projects, once we give leaders one clean screen for AHT, ASA, FCR, and abandon by queue and by agent, the conversation changes. People stop arguing about “how bad it feels” and start fixing actual bottlenecks in scripts, routing, or training.
Can I use speech analytics to find trends?
Listening to random recordings works for a while, then it breaks. There are more calls than supervisors, and important patterns stay hidden.
Yes. Speech analytics lets you mine recordings and transcripts for keywords, topics, sentiment, silence, and talk patterns so you can detect trends, common objections, and coaching opportunities at scale.
What speech analytics actually does
Speech analytics sits on top of your recordings and call metadata. At a high level it:
- Converts audio to text with speech-to-text.
- Splits the conversation into speaker channels (agent vs customer).
- Runs NLP and pattern detection on the transcript and audio features.
This lets you measure:
- How often key phrases appear: “cancel”, “supervisor”, “too expensive”.
- Which products or issues drive long calls or low FCR.
- Sentiment and emotion trends over the call.
- Agent behaviours: interruptions, long monologues, empathy phrases.
- Silence and hold patterns.
You can run this in batch after calls finish, or in near real time for live alerts.
Here is a simple map:
| Analytics type | Example questions it answers |
|---|---|
| Keyword / phrase hits | How often do people mention “refund” this month? |
| Topic clustering | What new issue themes are emerging? |
| Sentiment trend | Are customers more frustrated after our new policy? |
| Silence / overlap | Do agents leave callers in silence for too long? |
| Script adherence | Are agents using mandatory disclaimers and greetings? |
From “nice charts” to real change
Speech analytics is only useful if it links back to concrete actions.
Some practical ways to use it:
-
Tune your IVR and routing
If many calls start with “I pressed the wrong option” or “I already tried the app”, you know your menu or self-service flow needs work. -
Improve knowledge base and scripts
If certain topics always trigger long silences and holds, agents may lack clear answers. That is a signal to update knowledge articles, macros, or product training. -
Find coaching moments faster
Instead of sampling random calls, filter for conditions like:- Negative sentiment and low FCR.
- Long handle time with many “uhm” and holds.
- Escalations or customers asking for supervisors.
Supervisors then review a short, targeted list instead of guessing.
-
Feed product and marketing
Repeated phrases like “too expensive compared to X” or “does it work with Y system?” are gold for pricing, packaging, and product roadmap decisions.
You also need to think about privacy and compliance:
- Enable PII redaction for card numbers, addresses, or IDs.
- Limit who can see raw transcripts versus aggregated trends.
- Document how long you keep audio and text.
When this is in place, speech analytics becomes more than a fancy waveform viewer. It becomes a shared source of truth for operations, product, and management.
How do I connect analytics to my CRM data?
You might have great call data and rich CRM records, but they live in different silos. That kills many analytics projects before they start.
You connect analytics to CRM by using shared identifiers—numbers, call IDs, or case IDs—so each call’s metrics, transcript, and outcome link back to a single customer or ticket in one view.
Choose the right join keys
The goal is simple: when you open a contact or ticket, you see:
- Call history with AHT, FCR, queue, and agent.
- Links to recordings and transcripts.
- Outcomes like sale, renewal, or churn.
To build this, pick one or more join keys:
- Phone number: common and simple, but may be shared or changed.
- Call ID: unique per call, ideal for tying logs, audio, and analytics together.
- Ticket / case ID: best for service flows rooted in CRM.
- Account or customer ID: useful for long-term trend analysis.
A typical workflow:
- The SIP PBX or cloud system sends call events (start, answer, end, recording link) to the analytics platform.
- The CRM is updated with call IDs and recording URLs via CTI or API.
- Speech analytics processes the audio and sends back scores and tags (sentiment, topics, disposition).
- A data pipeline or iPaaS tool merges all these into a single model: one row per call, linked to customer and agent.
Here is a simple mapping:
| System | Key fields | Role in analytics |
|---|---|---|
| SIP PBX / CDR | Call ID, timestamps, queue, agent | Core telephony metrics |
| Recording / ASR | Call ID, transcript, sentiment, tags | Conversation content and quality signals |
| CRM / Helpdesk | Customer ID, case ID, outcome | Business result and context |
Which dashboards help me coach agents faster?
Supervisors drown in stats but have little time with agents. If dashboards are not focused, coaching turns into reading numbers out loud.
The best dashboards separate real-time control from coaching and QA. Use live wallboards for queues and simple, agent-level scorecards with trends, transcripts, and examples for fast, targeted coaching.

Build dashboards for different jobs
Try to avoid one “mega dashboard” that tries to do everything. Instead, design views by role:
- Real-time wallboard for team leads.
- Operations / capacity dashboard for planners.
- Agent coaching and QA dashboard for supervisors.
- Executive summary for management.
A simple classification:
| Dashboard type | Main user | Key questions it answers |
|---|---|---|
| Real-time wallboard | Team lead | Do we need to act now? |
| Operations / capacity | WFM / IT | Do we have the right staffing and routing? |
| Agent coaching | Supervisor | Who needs help, and with what behaviour? |
| Executive summary | Management | Are we meeting service and revenue goals? |
Coaching dashboard essentials
For coaching, you care less about second-by-second queue stats and more about patterns and examples. A good agent-level view often includes:
- AHT vs team average.
- FCR and repeat-contact rate.
- CSAT or NPS if you have surveys.
- Sentiment trend over recent calls.
- Top topics or complaint drivers.
- Number of escalations.
- Flags from speech analytics (no greeting, missing disclaimer, negative sentiment).
Plus, and this is important:
- Quick links to example calls that match those patterns.
- Short snippets or transcript highlights around key events.
Then a coaching session can look like this:
- Pick one or two metrics where the agent diverges from peers.
- Open two or three calls that match those patterns.
- Listen to specific moments, not full hours of audio.
- Agree on one small behaviour change for the next week.
For agents using IP phones or SIP intercoms integrated into a unified system, you can also include:
- Device type and site data (to separate network issues from behaviour).
- MOS or quality scores (to avoid blaming agents for poor audio).
Once coaching dashboards are in place, supervisors spend less time digging and more time teaching. Agents see a fair and transparent picture of their work, not random recordings pulled out of context.
Conclusion
Call analytics links your VoIP data, speech insights, and CRM outcomes so you can track real KPIs, spot trends, and coach agents faster with clear, shared evidence.
Footnotes
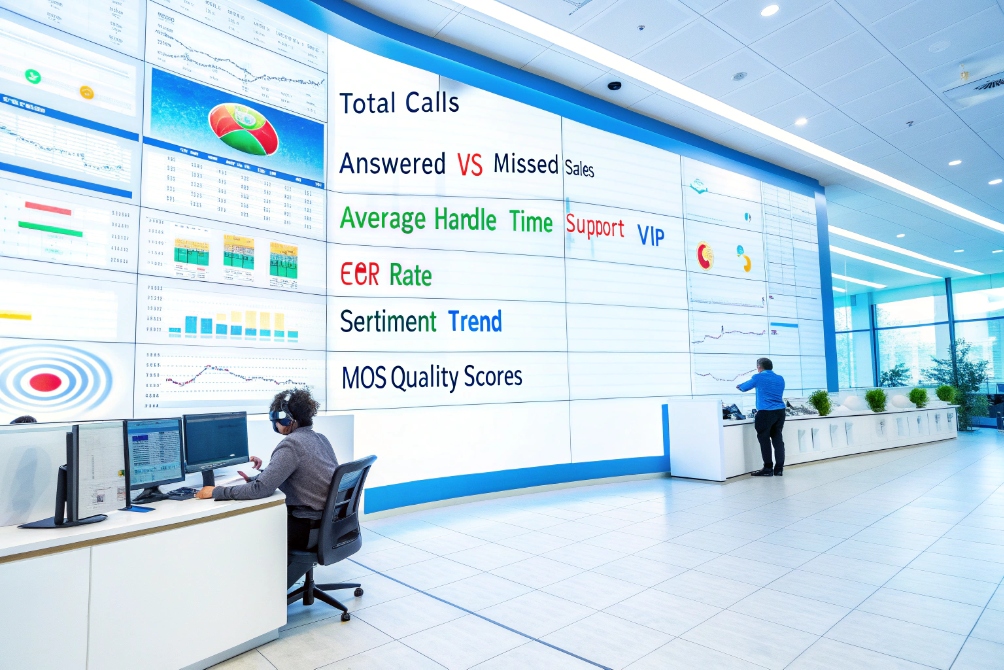
-
Example KPI wallboard visual for understanding common contact-center metrics at a glance. ↩ ↩
-
Definition of CDR fields and how call records are used for billing and reporting. ↩ ↩
-
Official MOS methodology reference used to interpret voice quality scoring in telephony. ↩ ↩
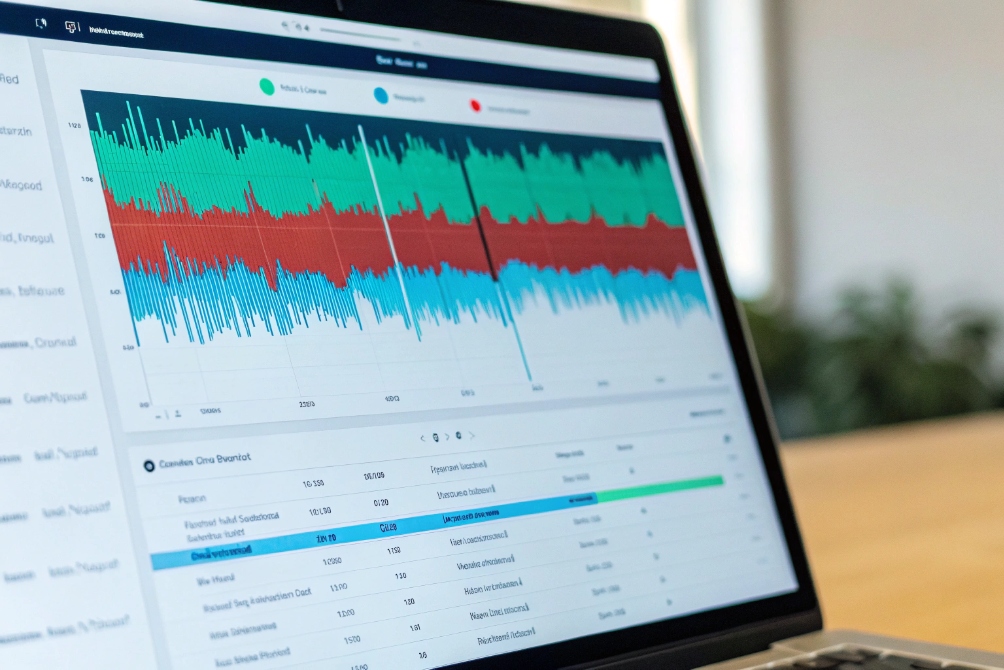
-
Dashboard mockup illustrating how teams present AHT, FCR, and related KPIs for leadership. ↩ ↩
-
Visual interface reference for how speech analytics surfaces patterns from recordings and transcripts. ↩ ↩
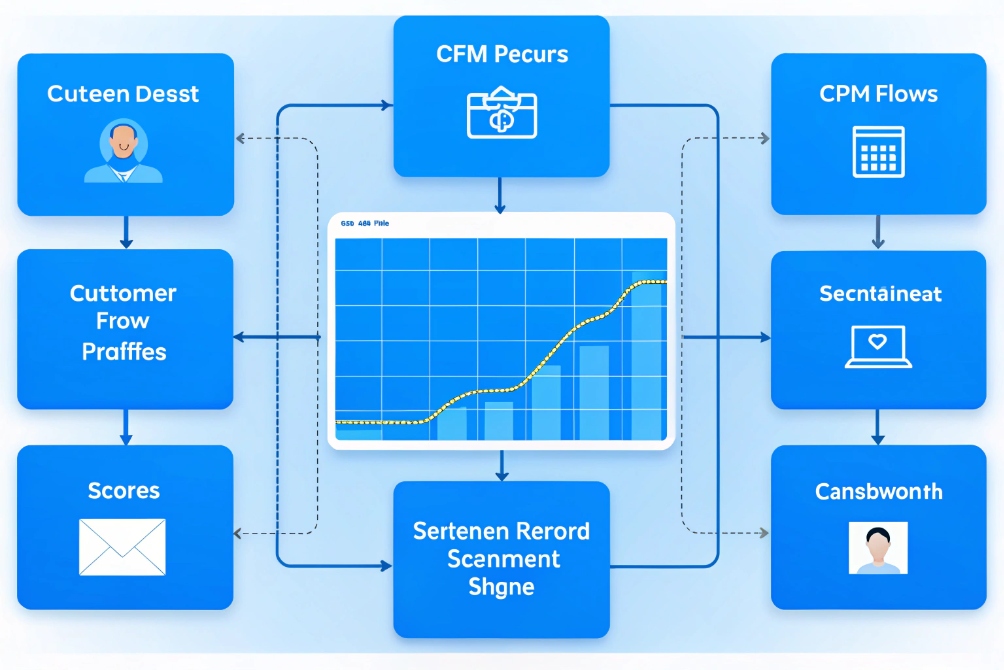
-
Diagram showing how call events and CRM records can be joined into a single analytics workflow. ↩ ↩
-
Operations video-wall example for separating real-time control dashboards from coaching views. ↩ ↩