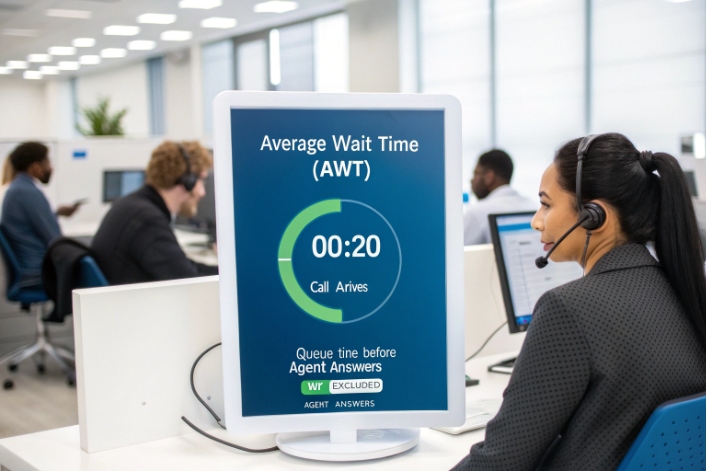
Callers hate waiting in a queue with no clear end. Call center average wait time (AWT) 1 helps quantify how long they actually wait before reaching an agent.
Call center average wait time (AWT) is the average time callers spend waiting in the queue before an agent answers, usually excluding IVR/menu navigation and after-hours announcements.

Average wait time sits at the center of the contact center story. It connects demand, staffing, and customer patience in a single number. When this metric is clear and stable, it guides capacity planning, service-level design, and even how we design IVR and self-service. When it is messy, we argue about “feelings” instead of facts, and we either overstaff or accept hidden damage in customer experience.
How do I calculate average wait time?
Many reports show several “time” metrics. It is easy to mix them up and pick the wrong one. That leads to bad goals and wrong fixes.
Average wait time is usually total queue time for answered calls divided by the number of answered calls, for a defined period, focusing only on time in queue before answer.

The standard AWT formula
For most modern platforms, average wait time calculation 2 has a simple definition:
AWT = (Total queue wait time for answered calls) ÷ (Number of answered calls)
Key points behind this formula:
- It uses answered calls only. Abandoned calls do not enter the math.
- It measures queue time, not IVR/menu time, and not after-hours prompts.
- It often ignores after-hours and system-failed calls, which never reached a live queue.
Short-abandon rules affect how we read AWT-related metrics, but they do not change AWT itself. Short abandons never reach “answered” status, so they stay out of this formula.
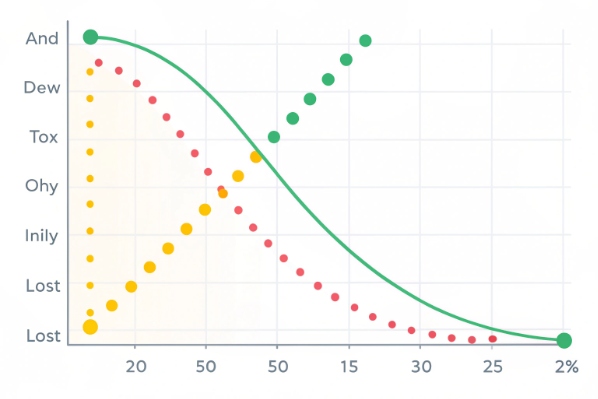
Because AWT is an average, it can hide extremes. A 10-second AWT may still mean that some callers waited 2 minutes while others got through almost instantly. That is why many teams also look at a distribution view (for example, % of calls answered in 0–20 sec, 21–40 sec, and so on).
Here is a simple numeric example for one hour in a support queue:
| Metric | Value |
|---|---|
| Answered calls | 180 |
| Total queue wait time for those calls | 3,600 s |
| Average wait time (AWT) | 20 s |
| Abandoned calls in queue | 30 |
| Short abandons in IVR (< 3 s, excluded from AWT) | 15 |
In this case, AWT is 3,600 ÷ 180 = 20 seconds. Abandoned and short calls still matter, but they are for other metrics.
AWT vs ASA and other timing metrics
Average Speed of Answer (ASA) 3 sounds similar but is not the same. Many vendors define ASA as queue time plus ringing time once an agent is targeted. AWT cares only about the queue portion.
So we can think of it this way:
| Metric | What it usually includes | Main purpose |
|---|---|---|
| AWT | Time in queue until an agent answers | Measures perceived “on-hold” time |
| ASA | Queue time + ringing time | Ties closer to switch / routing performance |
| AHT | Talk time + hold during call + wrap-up | Measures full handling effort per contact |
In practice, I use AWT when I talk about customer patience and abandonment. I use ASA when I compare different platforms or routing setups. I use AHT when I model staffing and occupancy.
What is a good wait time benchmark?
Leaders often ask, “Is our wait time good or bad?” The honest answer is that it depends on your promise, your industry, and your callers’ urgency.
There is no single “good” average wait time, but many centers aim to answer most calls within 20–30 seconds and set AWT targets that support their service-level goals.
Align AWT with your service-level promise
A common call center service level "80/20" target 4 is “80/20”: answer 80% of calls within 20 seconds. This is not a law. It is just a simple, historic benchmark. Some teams choose 70/30, 90/30, or even stricter rules for critical lines.
Instead of copying a random standard, it is better to ask:
- How urgent are these calls for customers?
- What is the cost of delay or abandonment?
- How much budget do we have for staffing and technology?
Once we know the service-level goal, we can set an AWT range that fits. If our promise is “answer 80% in 20 seconds,” then an AWT around 15–25 seconds often supports that goal. If we see AWT drifting far above that, we expect abandonment and dissatisfaction to grow.
Example benchmarks by use case
Different queues deserve different targets. A blanket goal will either waste money or damage experience.
Here is a simple view that I share with many teams:
| Queue type | Typical AWT goal (rough guide) | Notes |
|---|---|---|
| Emergency / safety lines | 0–5 seconds | Answer almost instantly, with backup routing |
| Healthcare / critical support | 10–20 seconds | High urgency, low tolerance for delay |
| B2B tech support | 20–40 seconds | Many customers accept a short wait |
| General customer service | 20–60 seconds | Depends on brand position and volume |
| Low-urgency info / admin lines | 60–90 seconds | Cost focus, but watch abandonment closely |
| Sales / revenue lines | 10–30 seconds | Long waits mean lost deals |
I treat these not as rules, but as starting points. The right benchmark comes from real data. I watch how abandonment and satisfaction change as AWT moves up and down. Over time, the “sweet spot” becomes clear: long enough to keep cost reasonable, short enough to protect revenue and loyalty.
Which factors increase caller wait time?
When average wait time climbs, it is tempting to blame “heavy volume” and move on. But AWT usually rises because several smaller issues line up at once.
Average wait time goes up when arrivals spike, staffing and skills do not match demand, handle time grows, or technology and process issues slow agents down.

High AWT usually drives a higher call abandonment rate 5 as customers give up and hang up before reaching an agent.
Volume, staffing, and handle time
The core drivers of AWT are simple queue math:
- Call arrivals: how many calls hit the queue in each interval.
- Staffing: how many agents are logged in and ready.
- Average handle time (AHT): how long each call takes to process.
If arrivals grow and staffing stays flat, occupancy rises. When occupancy pushes above about 85–90% for long periods, wait time tends to spike. Small changes in AHT can have big effects at these levels. Even an extra 20 seconds per call can push AWT from “fine” to “painful.”
Transfers and re-queues also matter. A customer who gets moved between skills may wait three times, and each “secondary” wait adds to perceived delay. If we do not track these secondary waits, our AWT may look acceptable while customers feel something very different.
Process and technology friction
Beyond pure math, many softer factors can increase wait time without any change in call volume:
- Slow tools and screen pops make agents take longer on each call.
- Complex authentication steps stretch handle time.
- Poor knowledge bases force agents to search manually.
- Unclear routing sends calls to the wrong skill, then back again.
Estimated Wait Time (EWT) messages also play a role. If EWT is not accurate, callers may hang up and call again. These repeat calls inflate volume and push AWT higher, even if the original estimate looked “optimistic” on paper.
We can summarize key factors like this:
| Factor group | Example driver | Impact on AWT |
|---|---|---|
| Volume | Marketing campaign, outage, seasonality | Sudden spikes in queue size |
| Staffing | Under-forecasting, shrinkage, absenteeism | High occupancy, long queues |
| Handle time | New products, complex tools, training gaps | Fewer calls handled per hour per agent |
| Routing / skills | Many transfers, misrouted calls | Extra “secondary” waits for the same customer |
| Technology | Slow apps, system errors, IVR issues | Longer calls, restarts, and increased re-dials |
When I diagnose high AWT, I rarely see just one cause. The pattern is usually “a bit too much volume, a bit too little staffing, a bit too much handle time, plus a few routing and tool problems.” Fixing any one helps. Fixing three or four together brings AWT back under control.
How do I lower wait time efficiently?
Throwing more agents at the problem can work, but it is expensive and often temporary. A smarter approach attacks both demand and supply.
To reduce average wait time efficiently, improve forecasting and schedules, use self-service and deflection, offer queue callbacks, and route high-value or urgent calls with smart priorities.

Fix the math first: forecasting and staffing
The first lever is always call center workforce management 6. If forecasts are wrong, everything else works harder for smaller gains.
Key steps:
- Use historical data by interval, not just daily totals.
- Include marketing plans, seasonality, outages, and new launches.
- Apply proper queueing models to turn volume and AHT into staffing needs.
- Convert those needs into practical shifts that agents can work.
Run simple staffing models: use Erlang C staffing calculators 7 to see how many agents you need to hit a target with your volume and AHT. Without this, you may promise something you cannot fund.
Real-time management matters as well. When we see AWT rising and service level dropping, we can move breaks, pull people from low-priority work, or temporarily limit non-urgent activity. These actions protect the customer without permanent headcount increases.
Use routing, IVR, and self-service to trim demand
Once the basic staffing plan is healthy, we can reduce avoidable demand:
- Build IVR and digital self-service flows that actually solve simple tasks.
- Route calls by intent and skill so the first agent can handle the issue.
- Provide clear status information (for example, order or ticket updates) without an agent.
Good self-service and routing do not just “hide” calls. They prevent repeat contacts and shorten handle time on the calls that remain. This reduces occupancy and AWT.
Queue callbacks (virtual hold) are a special tool. They may not reduce actual wait in minutes, but they transform the experience. Callers do not feel trapped on hold, so abandonment falls. And when we pace callbacks smartly, we avoid sudden bursts that overwhelm agents.
Protect critical queues and VIPs with priorities
Not all calls are equal. Some queues, like emergency or high-value sales, deserve faster treatment. A simple priority model can make a big difference without huge cost:
- Give urgent or safety lines first access to available agents.
- Mark VIP customers or key accounts with higher queue priority.
- Define strict AWT caps for emergency devices (elevator phones, SOS points).
This way, even when the center is busy, we protect the most important customer moments.
Here is a simple view of common levers:
| Lever | What it changes | Best use case |
|---|---|---|
| Better forecasting | Matches staffing to load | All centers, especially with clear seasonality |
| Schedule optimization | Uses existing staff more wisely | Mixed full-time and part-time teams |
| Self-service / IVR | Removes simple calls from the queue | High volume of low-complexity intents |
| Queue callbacks | Reduces live hold, cuts abandonment | Peaks that cause sudden long waits |
| Smart routing / priority | Sends key calls to the front of the line | VIP, revenue, and safety-critical queues |
When these levers work together, AWT falls without blind overstaffing. Callers feel more in control. Agents feel less rushed. And leaders see a stable, predictable operation instead of constant “fire drills.”
Conclusion
Average wait time turns raw queue chaos into one clear signal; when we measure it cleanly and fix both staffing and journey design, we control waits without wasting resources.
Footnotes
-
Overview of average waiting time (AWT) as a core contact center performance metric. Back to content ↩
-
Guide to calculating average wait time and interpreting it alongside other call center KPIs. Back to content ↩
-
Explanation of Average Speed of Answer and how it differs from simple wait-time metrics. Back to content ↩
-
Discussion of common service-level targets such as the 80/20 rule in call centers. Back to content ↩
-
Definition of call abandonment rate and its relationship to long wait times and IVR design. Back to content ↩
-
Detailed guide to call center workforce management, forecasting, and scheduling best practices. Back to content ↩
-
Online Erlang C staffing calculator for translating volume and AHT into agent requirements. Back to content ↩