Running a contact center 1 can feel like trying to fix a plane while it is flying. Calls spike, systems freeze, and customers still expect fast, clear answers.
Call center management is the discipline of planning, running, and improving people, processes, and technology so a team can handle customer interactions at scale with consistent quality and cost control.

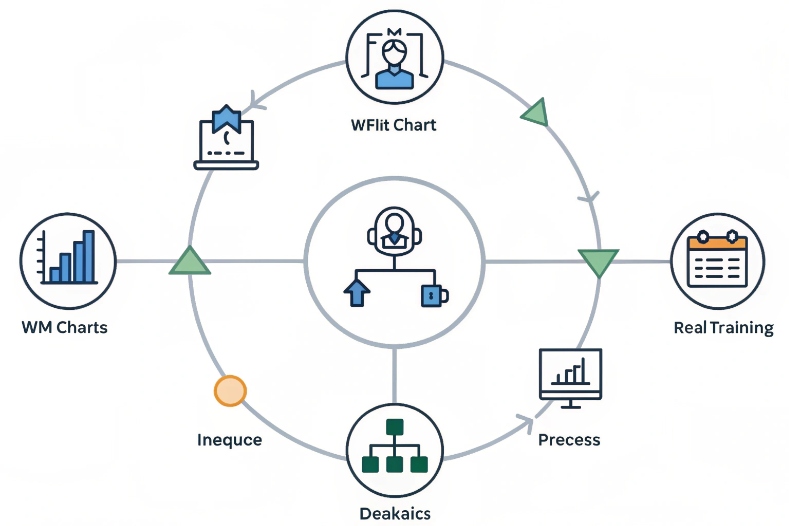
For me, it is not just about today’s queue. It is the full loop: forecast demand, staff and train people, design flows, monitor quality, learn from data, and then feed changes back into the system. When this loop is healthy, both customers and agents feel the difference.
Which KPIs matter most for my operation?
It is easy to drown in dashboards. Every platform throws new numbers at you, and soon no one remembers which ones really matter.
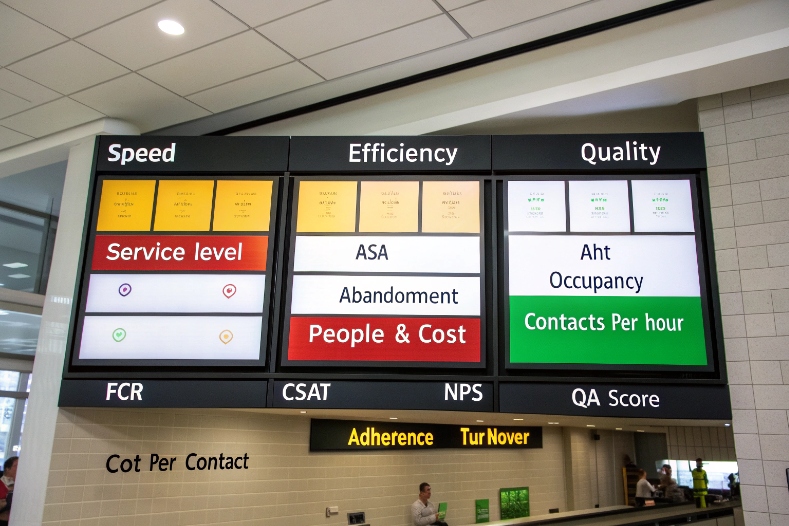
The core KPIs in call center management are service level, ASA/AHT, abandonment, occupancy, FCR, CSAT/NPS, adherence, and cost per contact. I pick a small set that matches my strategy, then align targets and coaching to them.
Making a simple KPI system that people actually use
In practice, I group call center KPIs 2 into a few clear buckets: speed, quality, people, and cost. That way, I do not optimize one in isolation and break the others.
1. Speed and accessibility
These show how fast customers reach help:
- Service level (for example, 80/20)
- ASA (Average Speed of Answer)
- Abandonment rate
These KPIs answer one question: “How long do customers wait before someone really helps them?” A healthy operation sets targets by channel and by line of business. For a sales line, I might be more strict than for a low-risk information line.
2. Efficiency and flow
Next, I look at how we use time once contact starts:
- AHT (Average Handle Time) – talk + hold + after-call work
- Occupancy – share of time agents spend on live work vs logged in
- Contacts per hour
Here, the trap is to chase low AHT without context. If I drive AHT down but repeats and complaints go up, I do not win. So I always view these with quality metrics beside them.
3. Quality and outcomes
Now I ask, “Did we actually solve the problem?” Measures like First Contact Resolution 3 show whether customers leave needing to reach out again.
- FCR (First Contact Resolution)
- CSAT (Customer Satisfaction)
- NPS (Net Promoter Score)
- Quality scores from QA forms
These metrics show if customers leave the interaction feeling helped and safe. FCR is especially important, because repeat contacts raise workload, cost, and frustration at the same time.
4. People health and fairness
A center cannot run well if agents are exhausted or feel the system is unfair. So I track:
- Schedule adherence
- Absence and turnover
- Coaching completion and QA calibration rates
Adherence tells me if the schedule on paper matches the real world. If adherence is poor across the board, I fix planning and rules first, not only agent behavior.
5. Cost and value
Finally, I need to link service to money:
- Cost per contact (by channel and queue)
- Revenue or retention per contact for sales and save teams
A simple summary table helps keep everyone aligned:
| Bucket | KPI examples | Main question |
|---|---|---|
| Speed | Service level, ASA, abandonment | Can customers reach us in time? |
| Efficiency | AHT, occupancy, contacts per hour | Do we use time well? |
| Quality | FCR, CSAT, NPS, QA scores | Do we solve problems and build trust? |
| People | Adherence, turnover, coaching | Can the team sustain this way of working? |
| Cost / value | Cost per contact, revenue per call | Is this model affordable and effective? |
From there, I pick a small “North Star set” for each function, so agents, supervisors, and leaders all know what really drives decisions.
How do I forecast and schedule agents?
If forecast is wrong or schedules are sloppy, every other part of management becomes a firefight. People burn out, and customers feel the pain in long waits.
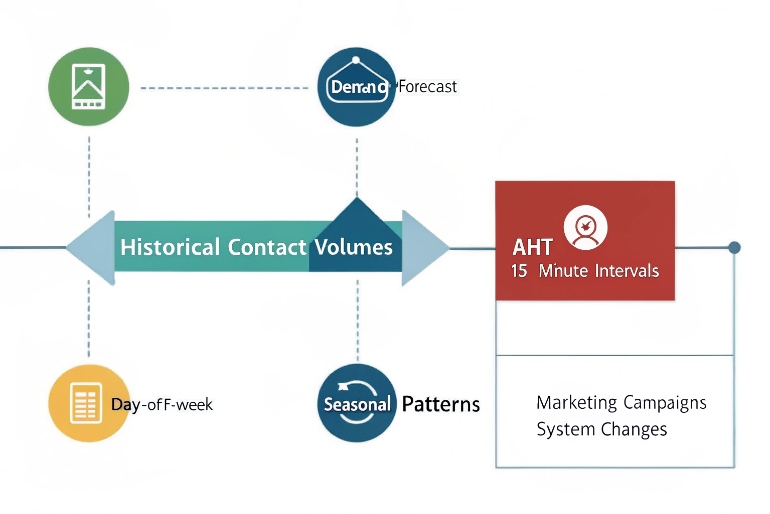
I forecast by using historical volume and handle time, events, and trends to predict future demand, then use workforce management to build schedules that hit service levels while balancing agent well-being and cost.
Turning past chaos into a forward-looking plan
Good forecasting is not magic. It is a repeatable process that gets a bit better each cycle.
1. Build a clean demand baseline
First, I define what I forecast:
- Contacts by interval (usually 15 or 30 minutes)
- By channel (voice, email, chat, messaging)
- By queue or skill (sales, support, language, VIP)
Then I use:
- Historical interaction counts
- Historical AHT for each queue and channel
- Known patterns: day-of-week, time-of-day, seasonality
I clean out one-off events that would distort the pattern, like system outages.
2. Add business and product events
Raw history is not enough. I layer in:
- Marketing campaigns and product launches
- Policy changes that drive questions
- Price changes or contract renewals
- Known outages or migrations
I treat these as uplift on top of the base forecast. The forecast may not be perfect, but at least it reflects what the business is planning.
3. Turn demand into staffing
With forecasted volume and AHT, I use a WFM tool or an Erlang-based model 4 to get:
- Required FTE by interval to hit the target service level
- Impact of shrinkage: breaks, training, meetings, absence
I include shrinkage as a percentage and make it visible to management. That way, no one is surprised when “10 online” becomes “8 available” after breaks and coaching.
A simple view:
| Step | Input | Output |
|---|---|---|
| Volume forecast | Historical contacts + events | Contacts per interval |
| Handling forecast | AHT per queue and channel | Load (seconds) per interval |
| Staffing model | Load + service level target | Base FTE per interval |
| Shrinkage apply | Breaks, training, absence | Required scheduled FTE |
4. Build schedules that humans can live with
From staffing numbers, I move to real shifts:
- Fixed vs flexible shifts
- Part-time vs full-time
- Multi-skill agents that float across queues
I try to:
- Respect local work rules and labor laws
- Give agents some choice and pattern stability
- Leave room for intraday changes
When agents have some control over their schedules, they are more willing to respect adherence and support coverage during peaks.
5. Use intraday management as a safety valve
Even the best forecast is wrong sometimes. So I set up:
- Real-time dashboards for volume, AHT, and service level
- Rules for moving people between tasks or channels
- Clear communication channels between WFM, supervisors, and agents
This way, I can react to spikes with skill changes or short overtime, instead of blaming individuals for structural gaps.
What tech stack suits omnichannel growth?
Voice is still the backbone in many operations. But customers now move between phone, email, chat, apps, and messaging without thinking about it. The tech stack must keep up.
For omnichannel growth, I build around a strong ACD/CCaaS platform, CRM, WFM, QM/recording, knowledge and Agent Assist, plus integrations with ticketing, payments, and data tools. All channels share one view of the customer.
Designing a stack that grows with channels, not against them
The goal is simple: one brain, many channels. Customers should feel one brand, not many disconnected systems.
1. Core interaction layer: ACD / CCaaS
This is where routing and queues live; ideally on a single omnichannel contact center platform 5 that handles voice and digital together.
- Inbound voice with IVR and skill-based routing
- Outbound campaigns where needed
- Digital channels: chat, email, messaging, social, in-app
Key needs here:
- SIP and WebRTC support for flexible endpoints
- Skills, priority, and language routing
- Queue management and overflow rules
If voice runs one way and digital runs another, supervisors end up managing two different worlds.
2. Customer and case system: CRM and ticketing
Next, I connect interactions to a single source of truth:
- CRM for customer profiles, contracts, and history
- Ticketing or case management for issue tracking and SLAs
Agents should not jump between five tabs just to see what happened last time. Screen pops and deep links help a lot here.
3. Workforce and quality layer
To control the operation, I need:
- WFM for forecast, scheduling, adherence
- QM and recording for call and screen capture, scorecards, and coaching workflows
These tools should pull data directly from the ACD/CCaaS and push results into reporting and BI. Then leaders see one story, not ten different reports.
4. Knowledge, assist, and training
To reduce variability and ramp time, I rely on tools like Agent Assist for contact centers 6 alongside a structured knowledge base and targeted learning.
- A searchable, structured knowledge base
- Agent Assist that nudges next steps or offers suggestions in real time
- Learning tools with short modules tied to QA gaps
This layer turns “tribal knowledge” into shared practice, which is key as new channels come online.
5. Data, security, and governance
Finally, I care about:
- Central analytics or a data warehouse with interaction-level data
- Secure storage of recordings and logs
- Privacy and consent controls, including recording and monitoring rules
- Business continuity and disaster recovery plans
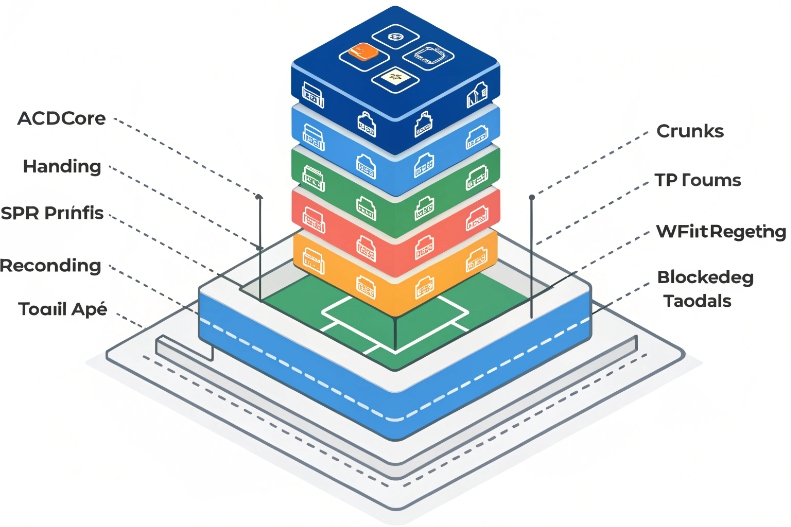
A simple view of the stack:
| Layer | Typical components | Main job |
|---|---|---|
| Interaction routing | ACD / CCaaS, IVR, SIP, WebRTC | Get the right contact to the right person |
| Customer and cases | CRM, ticketing, billing | Keep full context of the customer |
| Workforce and quality | WFM, QM, recording, screen capture | Plan people, monitor service, support coaching |
| Knowledge and assist | KB, Agent Assist, LMS | Help agents handle contacts correctly and quickly |
| Data and governance | BI, data warehouse, security, DR | Make decisions with data and stay compliant |
As channels grow, I try to plug them into this same backbone, not bolt on separate tools that cannot talk to each other.
How do I align QA, WFM, and coaching?
Many centers run these as three separate teams. QA writes scores, WFM pushes schedules, supervisors coach alone. Agents get mixed messages, and nothing really changes.
To align QA, WFM, and coaching, I use the same KPIs and interaction data as a shared source of truth, link scorecards to staffing and training plans, and run one continuous improvement loop instead of three separate ones.

Turning many functions into one improvement engine
The real power shows when planning, measurement, and development talk to each other every week, not once a quarter.
First, I make sure all three groups agree on:
- Which KPIs matter most (for example, service level, FCR, CSAT, adherence, cost per contact)
- What “good” looks like for a given contact type
- How we define behaviors on QA forms
Well-designed call center quality assurance scorecards 7 keep expectations clear and connect behaviors directly to outcomes.
For example, if QA pushes very long discovery calls, but WFM and finance push short AHT, agents will feel the conflict. We have to solve that at design level, not at the agent’s desk.
2. Connect QA results to staffing and training
QA is not just a score. It is a map of where we waste time or lose trust:
- If many calls fail on the same step, I can update scripts or knowledge.
- If new hires fail more often on a skill, I can adjust onboarding and nesting.
- If a process always causes long holds, I can raise this into process design and WFM models.
WFM then:
- Reserves time in the schedule for coaching and training based on QA trends
- Adjusts AHT assumptions when we simplify or fix processes
- Helps test changes with A/B style scheduling (for example, one team uses a new flow, one stays with the old one)
3. Give supervisors one clear coaching workflow
Supervisors are the bridge. I try to make their life simple:
- One coaching queue that pulls: QA results, performance metrics, and key calls
- Simple templates for 1:1 sessions that include behavior, metric impact, and next steps
- Time in the schedule reserved for these sessions, not just squeezed in around peaks
A basic cycle:
- QA and analytics flag a pattern.
- WFM blocks time for coaching on that pattern.
- Supervisors run focused sessions with clear actions.
- Metrics and QA scores are checked in the next cycle.
4. Use continuous improvement, not one-off fixes
Finally, I treat all this as a loop:
- Measure: KPIs, QA scores, agent feedback
- Find causes: root-cause sessions, process walks, listening to calls
- Change: update flows, tools, training, routing
- Test: compare AHT, FCR, CSAT, and agent effort before and after
- Standardize: bake the successful change into SOPs, KB, and training
A small summary of the alignment:
| Function | Main role | How it links to others |
|---|---|---|
| QA | Define and measure “good” calls | Feeds themes into coaching and process changes |
| WFM | Put the right people at the right time | Reserves time for training and coaching |
| Coaching | Change behavior and skill | Uses QA and KPI data, feeds back results |
When these three share one view of reality and one plan, agents get clear signals, customers get more consistent service, and leaders see steady progress instead of random swings.
Conclusion
Call center management is the art of turning chaos into a repeatable system. With the right KPIs, solid forecasting and WFM, a future-proof tech stack, and tight alignment between QA and coaching, the operation becomes calmer, more fair, and more valuable for the whole business.
Footnotes
-
Practical tips for running and improving day-to-day call center operations. Back ↩
-
Overview of the most important metrics for measuring call center performance. Back ↩
-
Why First Contact Resolution matters for efficiency and customer satisfaction. Back ↩
-
Erlang calculator for turning forecasted volume and AHT into staffing requirements. Back ↩
-
Introduction to omnichannel contact center platforms that unify voice and digital channels. Back ↩
-
How Agent Assist uses AI to help contact center agents in real time. Back ↩
-
Guide to designing call center QA scorecards and monitoring programs. Back ↩