Budget conversations in contact centers can get emotional fast. Leaders argue about headcount, vendors, AI, but no一 one can say, in simple numbers, what one call really costs.
Cost per call (CPC) is the average cost to handle one completed phone call, calculated as total call-related costs divided by the number of answered/handled calls in a period. It tells me how expensive my phone channel really is.

When I understand cost per call (CPC) 1, I stop guessing. I see which call types are expensive, which processes burn money, and where AI or IVR makes a real difference. The trick is to calculate it cleanly, include the right costs, and keep service quality in the picture so I do not “save” money by breaking the experience.
How do I calculate cost per call accurately?
Many teams throw all costs and all calls into one formula. The number looks neat, but it hides more than it reveals.
To calculate cost per call, I sum all call-related costs for a period, then divide by the number of completed calls I choose to include. I separate inbound and outbound, and I exclude abandoned, misdialed, or IVR-only calls when I want a clean handle-cost number.
From simple formula to useful metric
The basic formula for cost per call 2 is very simple:
Cost per call = Total call-related costs ÷ Number of handled calls
The value comes from how I build both the numerator and denominator.
1. Choose the right call count
First, I decide what counts as a “call” in this metric:
- Include:
- Answered inbound calls that reach an agent
- Outbound calls that connect and meet a “qualified” rule (for example, not just wrong numbers)
- Usually exclude:
- Abandoned calls that never reach an agent
- Very short misdials (for example, < 5–10 seconds)
- Calls fully handled in IVR or self-service, if I am focusing on live-agent CPC
If I include everything, the number may look lower, but it will blur the real cost of human support.
For pay-per-call advertising, I go one step further and define a qualified call:
- Minimum duration (for example, 60 or 120 seconds)
- Or a specific IVR path (for example, sales option, claims option)
Only these calls go into the denominator when I want to align ad spend with real conversations.
2. Define the cost period
Next, I pick a period that matches my planning cycle:
- Monthly for normal reporting
- Quarterly for trend analysis
- Weekly only if I have stable volume and costs
I make sure costs and calls use the same dates and hours, and I adjust for one-off events like a big outage.
3. Work a simple example
Say in one month:
- Total call-related costs: $120,000
- Handled inbound calls: 18,000
- Short misdials: 2,000 (excluded)
- Abandoned before agent: 3,000 (excluded from live CPC)
Then:
- Inbound cost per handled call = 120,000 ÷ 18,000 = $6.67
If I later deploy automation that cuts AHT and volume but keeps quality, I expect that number to move. The key is consistency. Same rules each month, so trends are real.
4. Split by direction and call type
Because drivers differ, I often break CPC into:
- Inbound vs outbound
- Call types: billing, simple support, complex tech, retention, sales
This can use activity-based costing 3. I assign costs to activities that belong to each call type, then divide by calls of that type.
That is how I find that simple balance checks cost $2–3, while complex technical calls cost $15+. Those insights tell me which flows deserve automation, AI assist, or a specialist team.
Which costs belong in my CPC model?
If I only include agent wages, my CPC will look very low. But it will not match reality. The operation runs on more than just front-line labor.
In my CPC model 4, I include agent labor, supervisors and QA, telecom, platforms, training, facilities, and a fair slice of overhead. I want the number to reflect the true all-in cost of running the phone channel, not just salaries.
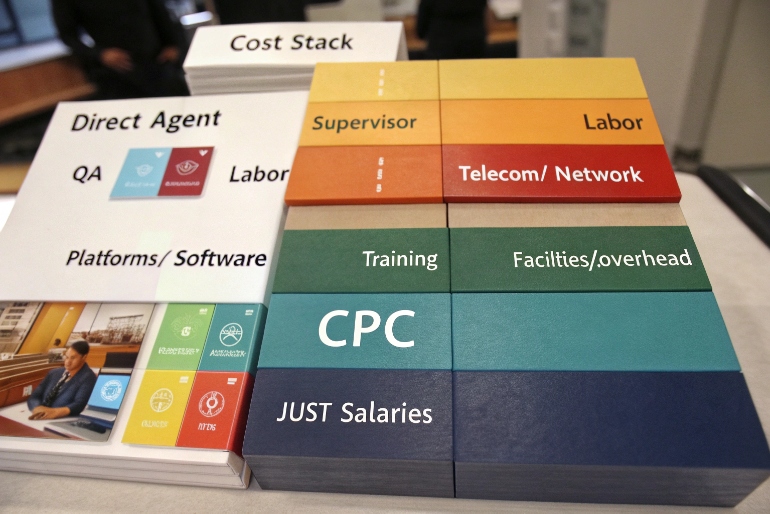
Building a complete and honest cost stack
I think of costs in layers. Each layer gets allocated to calls in a way that makes sense and is easy to explain.
1. Direct labor
This is the biggest piece in most centers:
- Agent wages or salary
- Benefits and mandatory contributions
- Shift premiums, overtime, incentives tied to calls
These costs are usually tracked per team or per site. I allocate them to calls based on:
- Actual time on calls and after-call work
- Or simpler, full paid hours for that group in the period
2. Support and management labor
Calls do not manage themselves. I include:
- Team leaders and supervisors
- QA analysts and trainers
- WFM staff who plan and monitor
Sometimes I allocate these in proportion to agent headcount or paid hours. Other times I split by team if I have clear mapping.
3. Telecom and network
Phone calls create real carrier and network costs:
- SIP trunks or carrier minutes
- Toll-free charges
- Number rental and call routing fees
- Network bandwidth dedicated to voice
If I can, I split these by inbound vs outbound and by region. If not, I allocate by call volume and handle time.
4. Platforms and software
The tech stack that supports calls includes:
- ACD/CCaaS platform
- Recording and quality tools
- CRM and ticketing used during calls
- WFM licenses related to call staffing
I usually spread these license and usage costs across all contacts that use these tools (calls, chats, emails), and then derive cost per contact and cost per call as needed.
5. Training and onboarding
Training is often treated as a separate budget, then forgotten in CPC. I prefer to:
- Annualize training costs (content, trainers, trainee hours)
- Allocate per productive agent, then per call
This reveals how much it really costs to keep skills fresh for complex products.
6. Facilities and overhead
Even in hybrid setups, I still have:
- Office rent and utilities
- Furniture, devices, headsets
- Security, IT operations, HR, finance
I do not need perfect precision here. A simple overhead rate (for example, 15–25% on top of direct labor and tech) can be enough, as long as I stay consistent and I can explain the logic.
A simple structure:
| Cost layer | Examples | Allocation idea |
|---|---|---|
| Direct labor | Agents | Time or paid hours |
| Support and management | Supervisors, QA, WFM | By team or ratio to agent labor |
| Telecom and network | Minutes, trunks, numbers | By call volume and duration |
| Platforms and software | CCaaS, CRM, WFM, QM | By users and contacts |
| Training | Onboarding, refreshers | Annual per agent, then per call |
| Facilities/overhead | Rent, utilities, shared services | Percentage add-on or per FTE |
When I include all of this, my CPC becomes a real tool for decisions, not a number I only show in budget season.
How do AI and IVR change my CPC?
AI and IVR 5 often get sold as “cost-cutting machines.” Reality is more nuanced. They shift where cost sits, and they change how volume flows.
AI and IVR change cost per call by deflecting simple calls into self-service, shortening handle time, and improving first-call resolution. At the same time, they add platform costs, and they push a higher mix of complex, longer calls to human agents.

Seeing automation as a mix shift, not just a discount
I look at AI and IVR impact across three things: volume, handle time, and mix.
1. Deflecting simple calls
Well-designed IVR and chatbots can:
- Fully handle simple intents (balance, status, password reset)
- Pre-collect data for the agent (ID verification, reason for call, account context)
This reduces:
- The number of calls that reach agents
- The handle time on calls that do reach agents
But if I only look at live-agent CPC, and I remove these deflected calls from the denominator, CPC might even rise. That is not a failure. It just means humans now handle harder work.
So I track both:
- Cost per live-agent call
- Cost per interaction across all channels and automation
That second one tells the true story of total support cost. Case studies on AI voice assistants reducing call center costs 6 show how much routine work can move to automation.
2. Shortening handle time with Agent Assist
AI does more than deflect:
- Suggest replies and next steps
- Auto-fill wrap-up codes and notes
- Surface the right knowledge article inside the desktop
This can:
- Reduce AHT
- Improve FCR by guiding agents to better answers
- Cut after-call work time
Here, CPC can drop even if volume stays flat, because I handle more calls with the same staffing. The AI license cost goes into the numerator, but the efficiency gain can more than offset it.
3. Changing the complexity mix
Once simple work moves to self-service, the remaining calls:
- Are longer
- Are more emotional
- Need better-trained agents
Average handle time and CPC per call may both increase, but each call also carries more value. For example, high-value sales or retention.
That is why I always link CPC with FCR, CSAT, revenue per call, and churn. A “more expensive” call can be a good trade if it saves a contract or drives a big sale.
4. Marginal cost and capacity
AI and IVR also change marginal cost:
- When I have idle agent capacity, the extra cost of one more call is low.
- When I am at capacity, the next chunk of demand forces new hires, training, and licenses, and marginal cost spikes.
Automation acts like a buffer. It can absorb part of demand spikes without new hires, which smooths CPC over time.
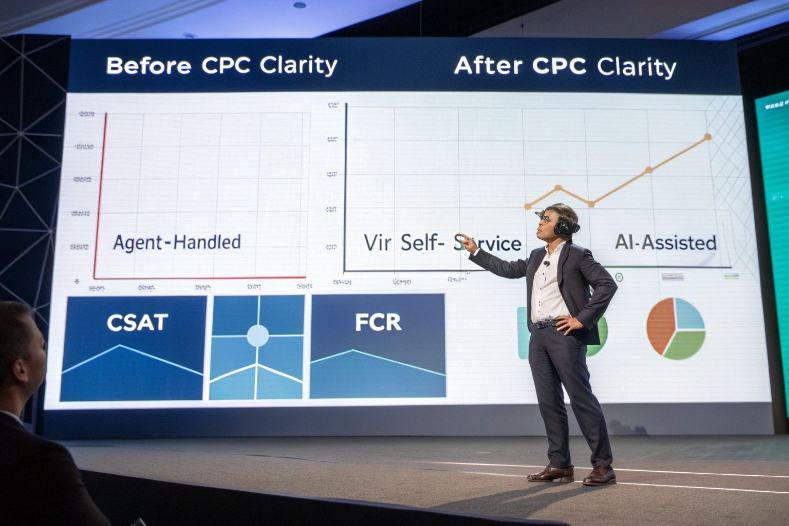
In short, AI and IVR do not automatically “slash CPC”. They reshape the cost curve. I try to measure:
- Cost per self-service interaction
- Cost per assisted interaction
- Impact on total support cost, FCR, and revenue
That picture is much more useful than a single “before vs after CPC” slide.
What CPC benchmarks fit my industry?
Sooner or later, someone asks, “Is our cost per call good or bad?” The honest answer is: it depends.
There is no single “good” cost per call. Benchmarks vary by industry, geography, complexity, and channel mix. Many operations fall somewhere between a few dollars and low double digits per call, but I care more about trends and value per call than chasing a global average.
Industry benchmark ranges for cost per call 7 show that many operations fall somewhere between a few dollars and low double digits per call. I treat external benchmarks as guardrails, not gospel.
Using benchmarks without becoming a slave to them
I treat external benchmarks as guardrails, not gospel.
1. Dimensions that move CPC
When I compare CPC, I adjust for:
- Industry and risk level
- Simple retail support vs regulated healthcare or finance
- Call complexity
- Short “where is my order” vs deep technical troubleshooting
- Channel mix
- Voice-heavy vs strong use of chat, email, and self-service
- Location and wage levels
- Onshore vs nearshore vs offshore
- Operating model
- In-house vs BPO vs hybrid
This is why one center can live with $3–4 per call, while another is healthy at $15+. The question is not “cheap or expensive” but “fair for the value and risk”.
2. Internal benchmarks first, external second
My favorite benchmark is my own history and portfolio:
- CPC by call type over the last 12–24 months
- CPC vs FCR and CSAT over time
- CPC for different vendors, sites, or teams handling similar work
This tells me where process changes, training, or automation had real impact. It also shows me which partners or sites are outliers, good or bad.
External benchmarks still help:
- They show if I am far outside a normal range for my region and sector.
- They support business cases when I ask for investment in tools or headcount.
But I never chase a global “average CPC” if it means cutting the wrong corners.
3. Connect CPC back to strategy
Finally, I link CPC to my positioning:
- If my brand is premium and trust-sensitive, I accept higher CPC with higher FCR and CSAT.
- If my business is high-volume and low-margin, I push more into automation and strict process, and I aim for a leaner CPC.
In both cases, CPC is not the hero metric. It is a steering wheel. I use it with AHT, FCR, CSAT/NPS, and revenue/retention metrics to decide where to invest and where to simplify.
Conclusion
Cost per call is a simple formula with deep consequences. When I calculate it cleanly, include real costs, and read it alongside quality and revenue metrics, it stops being a scary finance number and becomes a practical tool to design better, smarter customer service.
Footnotes
-
Glossary definition of cost per call as a core contact center efficiency metric. Back ↩
-
Walkthrough of the basic cost per call formula and inbound versus outbound nuances. Back ↩
-
Explanation of activity-based costing and how to allocate overhead fairly to services. Back ↩
-
Deeper guide on building a cost per call model and reducing CPC without hurting quality. Back ↩
-
Overview of how AI and IVR automation reduce agent workload and operating costs. Back ↩
-
Case study examples of AI voice assistants cutting call center costs by automating routine inquiries. Back ↩
-
Glossary entry discussing average cost per call ranges and drivers by operation type. Back ↩