Too many callers sit in your queue, listening to the same music. Abandonment creeps up, and dashboards glow red with missed targets.
Average Waiting Time (AWT) is the mean queue time for answered contacts, showing how long customers wait for an agent; you calculate it by dividing total queue wait seconds by the number of answered interactions in the period.

When you understand Average Waiting Time (AWT) 1, you stop arguing about “feeling busy” and start working with real numbers. AWT sits between your IVR, your ACD, and your staffing plans. It links routing rules, self-service, and callback design to hard outcomes like abandonment and CSAT. Let’s break it into clear steps: how to calculate it, what “good” looks like, how IVR and bots can help, and how all of this ties back to your SLAs.
How do I calculate my AWT?
Customers ask a simple question: “How long will I wait?” Your reports often give a more confusing answer, with AWT, ASA, EWT, and hold time mixed together.
You calculate AWT by summing the time every answered contact spent in queue, then dividing by the number of answered contacts in that interval, typically per queue or channel.
What exactly goes into AWT?
First, you define the window: maybe every 15 minutes, every hour, or per day. For that window, you look only at answered contacts:
- Start time: when the call or chat enters the queue, just after IVR or routing.
- End time: when an agent, bot, or handler accepts it from that queue.
You add all those queue wait seconds together, then divide by how many contacts were answered.
Simple formula:
[
\text{AWT} = \frac{\sum \text{queue wait time of answered contacts}}{\text{number of answered contacts}}
]
Key points from real deployments:
- AWT usually excludes IVR/menu time before the queue.
- AWT usually excludes ringing after the agent is targeted.
- AWT ignores after-hours traffic that hits closed messages and never queues.
Short-abandon filters (for example, “ignore abandons under 5 seconds”) affect your abandonment rate, but they do not change AWT, because AWT only counts answered contacts.
AWT vs ASA and per-queue reporting
Many platforms report both AWT and ASA (Average Speed of Answer (ASA) 2). They sound similar but are not the same:
| Metric | What it includes | Focus |
|---|---|---|
| AWT | Pure time in queue before answer | Queue experience |
| ASA | Queue time + ringing time before answer | End-to-end answer speed |
For voice, I prefer AWT when we try to tune routing and staffing, and ASA when we look at the full customer wait. For digital channels, the idea is the same: you measure time from entering a “workbasket” until an agent accepts the item.
Always break AWT down by:
- Queue or skill (billing, tech, sales).
- Channel (voice, chat, email, social).
- Site or region if you run multiple centers.
Transfers create secondary waits. Good systems track both the first AWT and each extra wait after transfers, so you can see where customers get stuck a second time.
Once you calculate AWT in a clean and consistent way, you can link it to forecasting models, routing design, and self-service changes. Without that discipline, you only move noise around.
What is a good AWT for my industry?
Leaders often ask for a magic number, like “20 seconds is good, 60 seconds is bad.” Real life is more nuanced. Risk, emotion, and channel all change what “good” means.
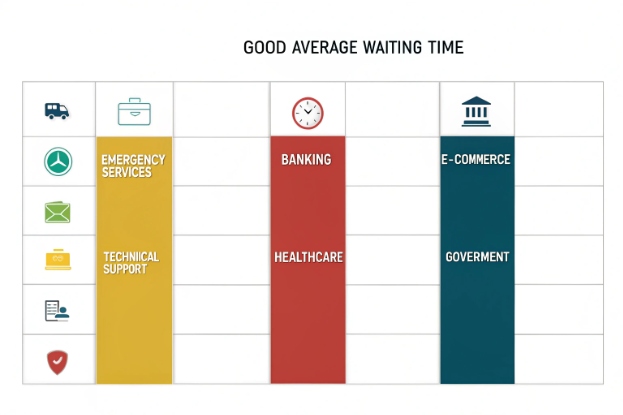
A good AWT depends on intent and industry, but many real-world targets fall between 20 and 60 seconds for live voice support, with stricter goals for emergency or premium lines.
Typical ranges by use case
These are simple guide rails, not strict rules. I have seen centers succeed outside these ranges when they set the right expectations.
| Industry / intent | Typical “good” AWT band | Notes |
|---|---|---|
| Emergency / critical support | Under 10–20 seconds | Often treated as a “zero wait” target |
| Banking and insurance service | 20–45 seconds | Sensitive topics, people wait but not for long |
| E-commerce customer service | 20–60 seconds | Peaks around campaigns and holidays |
| Technical support (complex) | 30–90 seconds | People tolerate more if first-contact fix is high |
| Healthcare scheduling | 20–60 seconds | Emotions high, clear communication matters |
| Government / public services | 30–120 seconds | Demand spikes; transparency about waits is key |
Digital channels often have longer accepted “waits” because they are not synchronous in the same way. For chat, you might treat 30–60 seconds as a clear target for first response. For email, you may measure in hours, not seconds.
How to pick a target that fits your reality
Instead of chasing a generic number, use three inputs:
-
Customer expectation
Look at CSAT or survey data. At what wait time do scores drop sharply? Where do complaints spike? That point is more important than any global “benchmark”. -
Business risk and value
For high-risk or high-value calls (fraud, medical, outages), pick much lower AWT targets and protect them with priority routing and backup staffing. -
Cost and staffing
Shorter AWT needs more flexible staffing or better self-service. You balance “nice to have” against real budget limits.
A simple design pattern:
- Set an overall AWT band for the center (for example, 20–40 seconds).
- Set stricter targets for VIP and urgent queues.
- Set slightly softer targets for low-risk, low-complexity work.
Tie AWT targets directly to service level goals like "80% of calls answered within 20 seconds" 3. AWT gives the average; the service level tells you how many customers feel that experience. You need both views to decide if your target is realistic.
How can I reduce my AWT with IVR or bots?
You can always throw more agents at the problem, but that is expensive and often slow to change. IVR and bots can reduce AWT without a full headcount jump.
You reduce AWT by shrinking demand on live queues, routing with better intent and skills, offering callbacks, and using bots to complete or triage tasks before they reach agents.
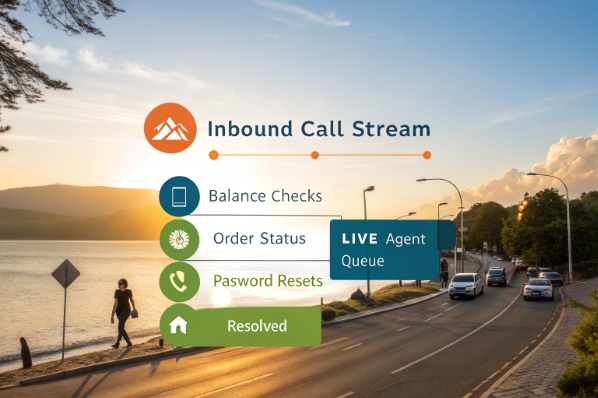
Reduce the number of calls that need the queue
The fastest way to cut AWT is to keep some contacts out of the queue entirely.
Practical steps:
- Add self-service for high-volume, low-complexity tasks 4: balances, order status, password resets, appointment confirmations.
- Use IVR and voice bots to handle simple verification before passing to an agent.
- Push clear outbound notifications for events like delivery changes or outages, so people do not need to call in at all.
A small mapping helps:
| Use case | Self-service option | Queue impact |
|---|---|---|
| Balance / bill inquiry | IVR or bot with live system lookup | Fewer calls reach billing agents |
| Order or delivery status | IVR lookup, SMS links, web self-service | Lower peak spikes after shipping events |
| Appointment reminder | Outbound call or SMS with self-confirm | Fewer inbound “confirm / reschedule” calls |
Even a modest containment rate on big intents (for example, 20–30%) can pull enough demand out of queues to shift AWT.
Route smarter, not just faster
A blunt IVR that dumps every call into a single “general” skill wastes time. A smarter front-end narrows each call to the best target.
Use IVR or bots to:
- Capture intent (“billing question”, “technical issue”, “cancel service”).
- Capture language preference and simple profile flags.
- Pass that data to the ACD as routing keys.
Then the ACD can:
- Apply skills-based routing to match agents with the right skills.
- Use priority routing for VIP or urgent intents.
- Use overflow rules when one site or skill is saturated.
Better routing cuts re-transfers and secondary waits. That does not always show up directly in first AWT, but it shows up in total time in system and in fewer frustrated callers saying “I already told the last person this.”
Use callbacks and digital deflection
When queues spike, even the best IVR will not make AWT magically small. Two tools help here:
- Queue callbacks / virtual hold: let callers keep their place in line without staying on the phone. This does not always lower raw AWT, but it reduces perceived wait and in-queue minutes.
- Channel shift: offer to move some callers to chat or messaging when that capacity is free.
In SIP environments, callback flows are just another routing path. The key is pacing:
- Limit how many callbacks you create per interval.
- Make sure you have outbound capacity to deliver them.
- Track time-to-callback as its own KPI.
When queue callbacks / virtual hold 5 are configured well, this strategy can dramatically cut perceived wait, especially during recurring peak periods.
If you combine smart self-service, good routing, and callbacks, you usually see both AWT and abandonment fall, without a massive change in headcount.
Does my AWT impact SLAs and CSAT?
Sometimes teams focus so hard on AWT dashboards that they forget the real question: “Do we keep the promises we made to customers, and do they walk away happy?”
AWT sits at the center of your service levels and CSAT: longer waits drive higher abandonment and lower satisfaction, while stable, predictable waits support realistic SLAs and calmer customers.
How AWT ties into SLAs
Most contact center SLAs look like this:
- “Answer 80% of calls within 20 seconds.”
- “Respond to 90% of chats within 60 seconds.”
These are service level targets. AWT is the average across everyone who got served. The math links them:
- If your AWT is very low, your service levels are likely strong.
- If your AWT climbs, the share of customers who wait beyond your SLA threshold climbs too.
Think of it this way:
| AWT band | Likely SLA impact |
|---|---|
| Under target | Most customers answered within SLA |
| Near target | SLA becomes sensitive to small volume spikes |
| Above target | Large chunk of customers miss SLA |
Estimated Wait Time (EWT), which you often play in IVR, uses live queue length and handle-time forecasts. It does not change AWT directly, but it helps you manage perception. Honest EWT messages (“about five minutes”) plus callback options can keep CSAT higher even when AWT is not ideal. The platform can calculate this Estimated Wait Time (EWT) 6 using queue length, current handle times, and staff levels.
How AWT influences abandonment and CSAT
Long waits raise two direct pain points:
- Abandonment: customers hang up or leave the channel before they reach an agent.
- CSAT / NPS: even if the agent is great, a painful wait drags scores down.
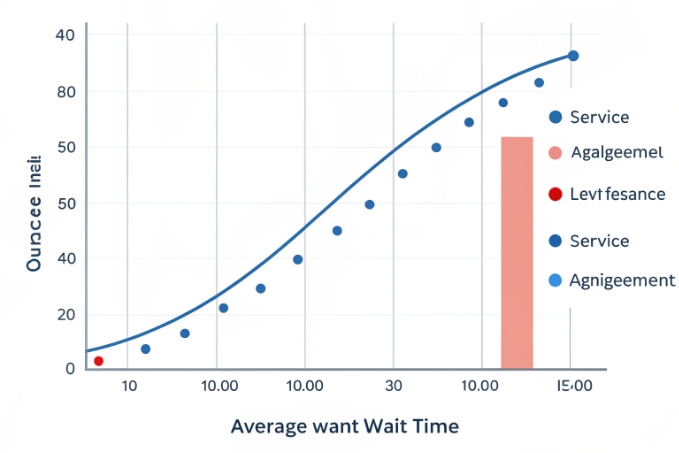
In most centers, you can see clear patterns:
- Abandonment rises as AWT grows, especially beyond the first 30–60 seconds.
- CSAT drops sharply once waits cross a “frustration line” that depends on your industry.
- Repeat contacts (“I called earlier and could not get through”) add more load and more frustration.
A simple view:
| AWT level | Customer reaction |
|---|---|
| Very low (0–20 seconds) | Feels fast, often “I got through right away.” |
| Moderate (20–60 seconds) | Usually acceptable if issue is resolved |
| High (60–180 seconds) | Noticeable frustration, rising abandons |
| Very high (3+ minutes) | Many give up or complain |
Because of this, I like to track four numbers together:
- AWT by queue and channel.
- Service level against your promise (for example, 80/20).
- Abandonment rate 7 and where in the queue people drop.
- CSAT or NPS split by wait-time bands.
When these four move in the right direction, you know that your changes to IVR, routing, staffing, or bots are not only “moving metrics” but also making life better for customers and agents.
Conclusion
Average Waiting Time is more than a single number; it links your queues, routing, self-service, and staffing to real customer emotions, SLAs, and costs, so you can improve with intent.
Footnotes
-
Definition of Average Waiting Time and why it matters in call center operations. ↩ ↩
-
Explanation of Average Speed of Answer and how ASA differs from pure queue waiting time. ↩ ↩
-
Discussion of the classic 80/20 call center service level target and its practical limits. ↩ ↩
-
Best practices for building IVR self-service for high-volume, low-complexity contact reasons. ↩ ↩
-
Guide to implementing virtual hold and callback solutions to reduce perceived wait time. ↩ ↩
-
Overview of Estimated Wait Time calculations and how EWT predictions are generated in call centers. ↩ ↩
-
Detailed look at call abandonment rate, its calculation, and strategies to reduce abandons. ↩ ↩